

Connection method
As we’ve mentioned several times in our introductory courses, the Alumio iPaaS is a cloud-native, low-code, and API-driven integration platform. In this course, we’ll explore what this actually means in practice.
By leveraging standardized API connectivity, Alumio allows different systems to communicate seamlessly, exchange data efficiently, and automate complex business processes without the need for extensive coding. Let's now experience how the user-friendly, low-code web interface of the Alumio iPaaS streamlines data exchange via easy click-and-configure tools and interfaces.
To simplify our walkthrough of helping you build your first integration, we’ll use an example integration. We will show you how to deploy an integration between Picqer, a warehouse software for online stores, and the popular e-commerce platform Shopify. As part of the walkthrough, we’ll show you how the Alumio iPaaS can be used to swiftly integrate product data from Picqer to Shopify, in order to demonstrate how to build your first integration.
Step 1: Establishing your connection method
Your integration journey with the Alumio iPaaS begins by defining a connection method. This is especially true if you’re integrating an application and establishing its credentials within Alumio for the first time. Since we’re integrating Picqer and Shopify in this course, it’s important to first define how you wish for Alumio to interact with your Picqer application and Shopify web shop.
APIs define the protocols and rules for how software systems and applications communicate with each other. Thus, catering to different types of API interactions and integration scenarios, the Alumio iPaaS provides several connection methods when choosing to integrate endpoints:
- HTTP (API): Enables integration with remote web services using HTTP clients to read and write data, supporting authentication methods like Basic, OAuth 2, and Bearer Token for secure access.
- Database: Connects to popular databases like MS SQL, MySQL, PostgreSQL, and Oracle using database clients, simplifying incoming and outgoing data configurations.
- SOAP: Connects to SOAP-based web services using WSDL files or manual configurations, enabling data exchange with systems that rely on XML-based communication. Supports authentication, response validation, and multiple request handling.
- HTTP Proxies: Enables external applications to request real-time data from other systems via Alumio by creating an API endpoint for seamless connectivity and secure data exchange.
- Webhooks: Facilitates event-driven, real-time data pushes from external systems to instantly trigger processes. It enables external applications to send real-time data to Alumio by creating an API endpoint for seamless data exchange and processing.
- Filesystems: A filesystem represents a (remote) environment that is used to host files. Filesystems that Alumio helps connect include SFTP, AWS S3, Google Cloud Storage, and WebDAV.
- HTTP Authentications: Secures API communications by managing authentication credentials and protocols efficiently. They support various authentication methods, such as Basic Authentication, Bearer Tokens, and API Keys.
Therefore, before we start configuring your Route and building integrations, it’s important to choose and establish a connection method for the application you want to receive data from and send data to. So, let’s start building our integration by first choosing a connection method.
Step 1(a): Setting up a connection method for application A
As per our example, since we’re integrating data between Picqer and Shopify, we will establish a connection method for both applications as follows:
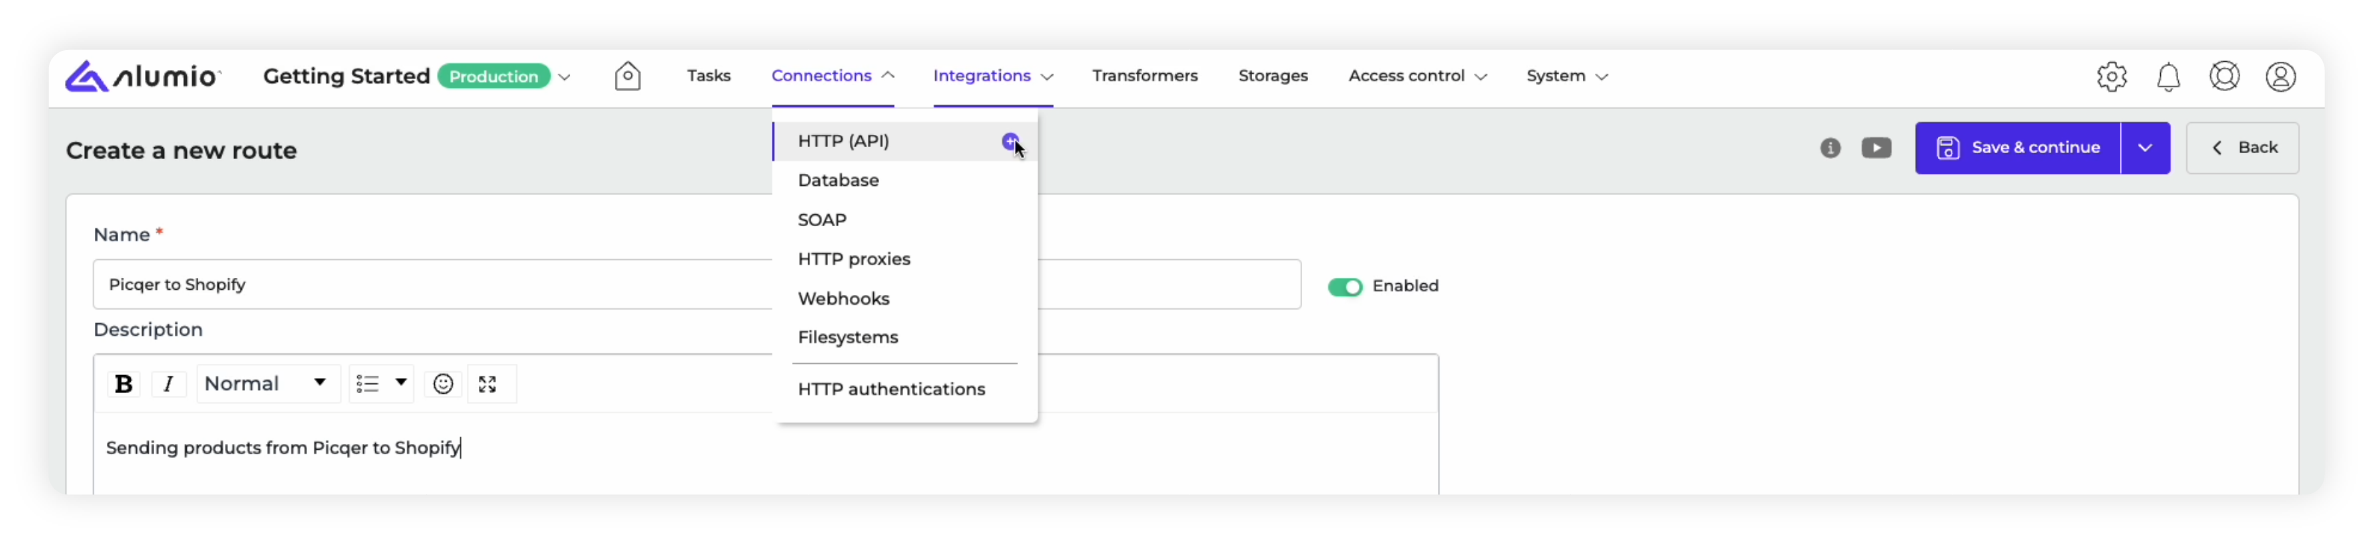
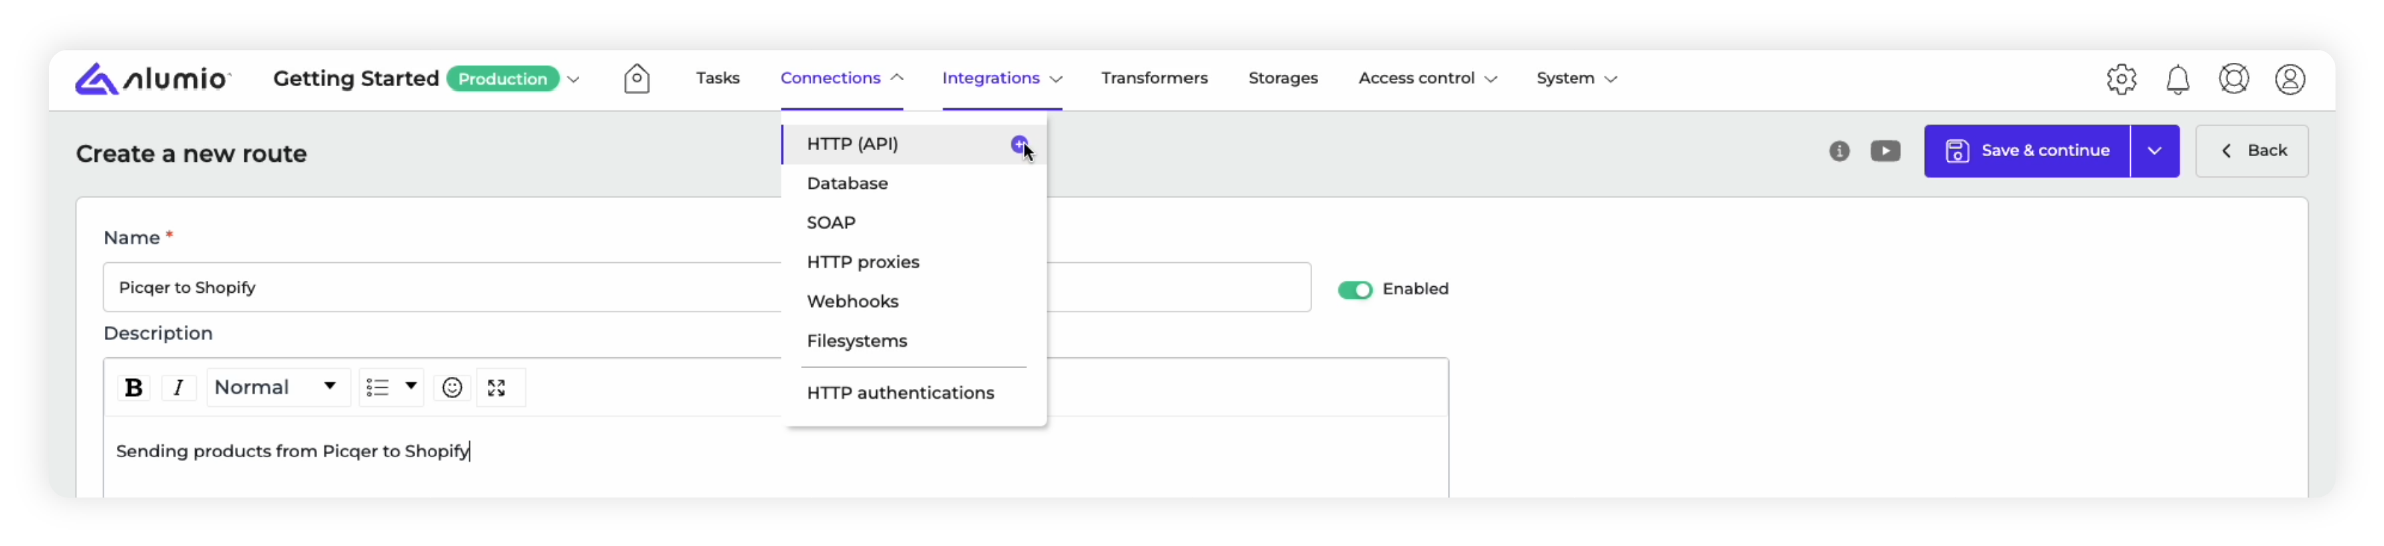
1. Connections: Move to the navbar at the top and select your connection method. In this case, we will select the HTTP (API) method from the list of connection methods, by clicking the “+” icon next to it.
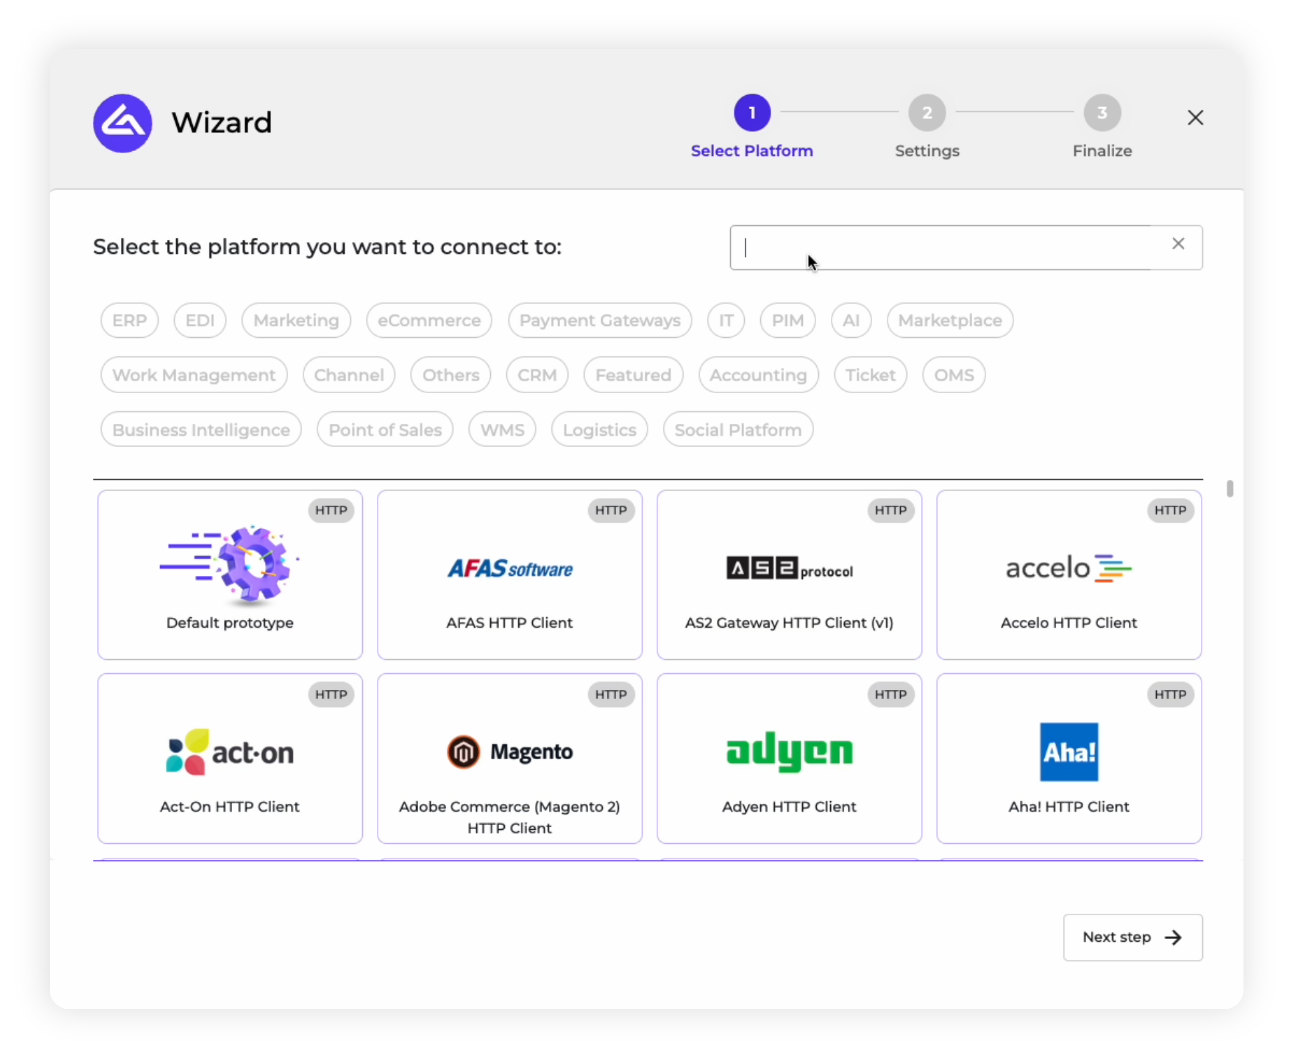
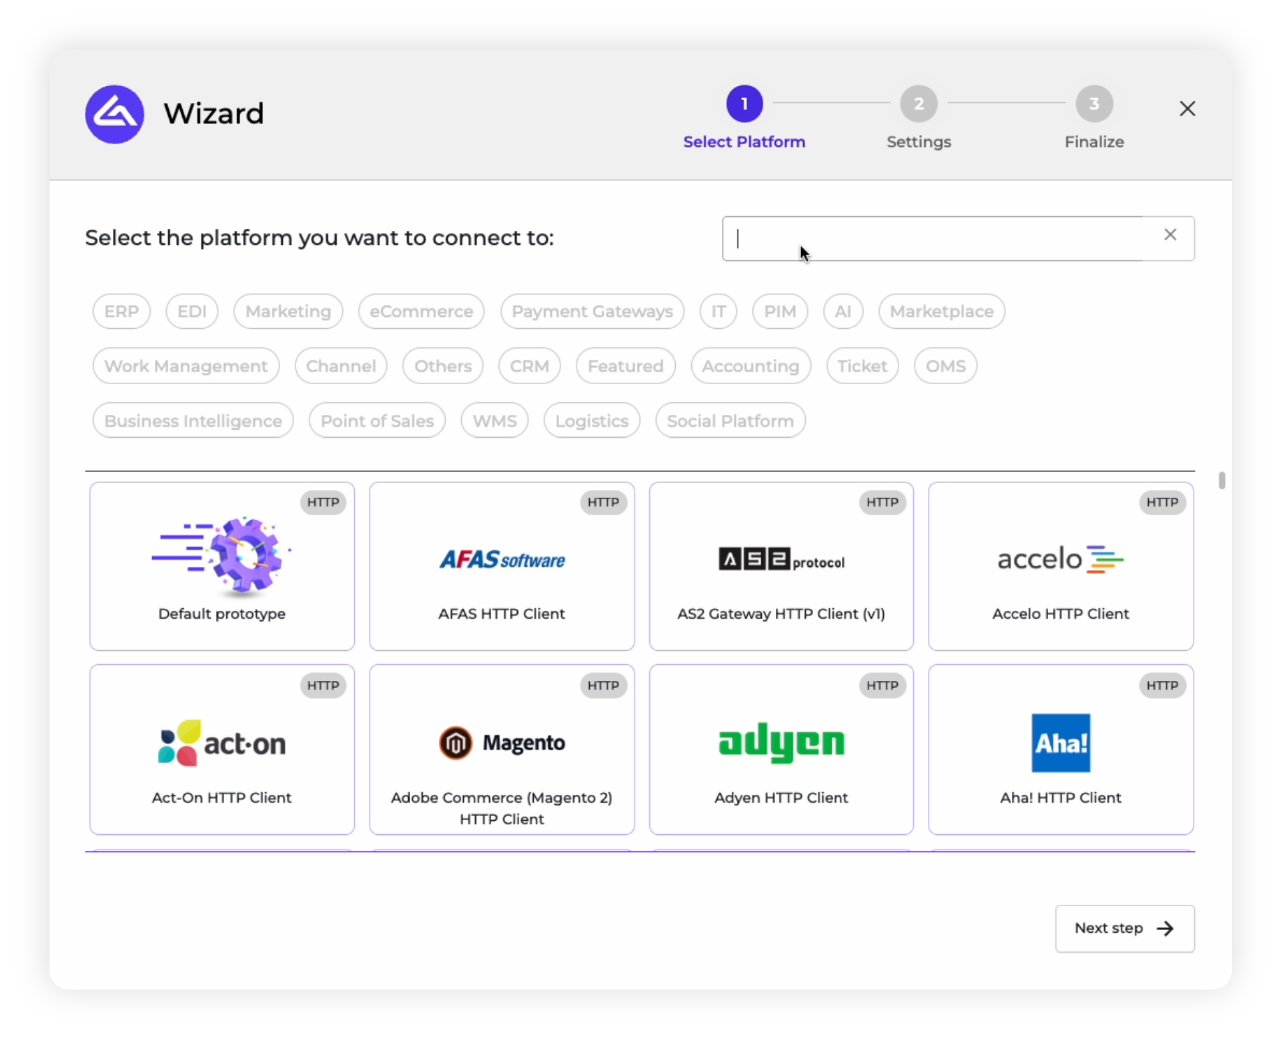
2. Connectors: This will open our HTTP client connection wizard that we can use to search for the Connector of the first application you wish to integrate via Alumio.
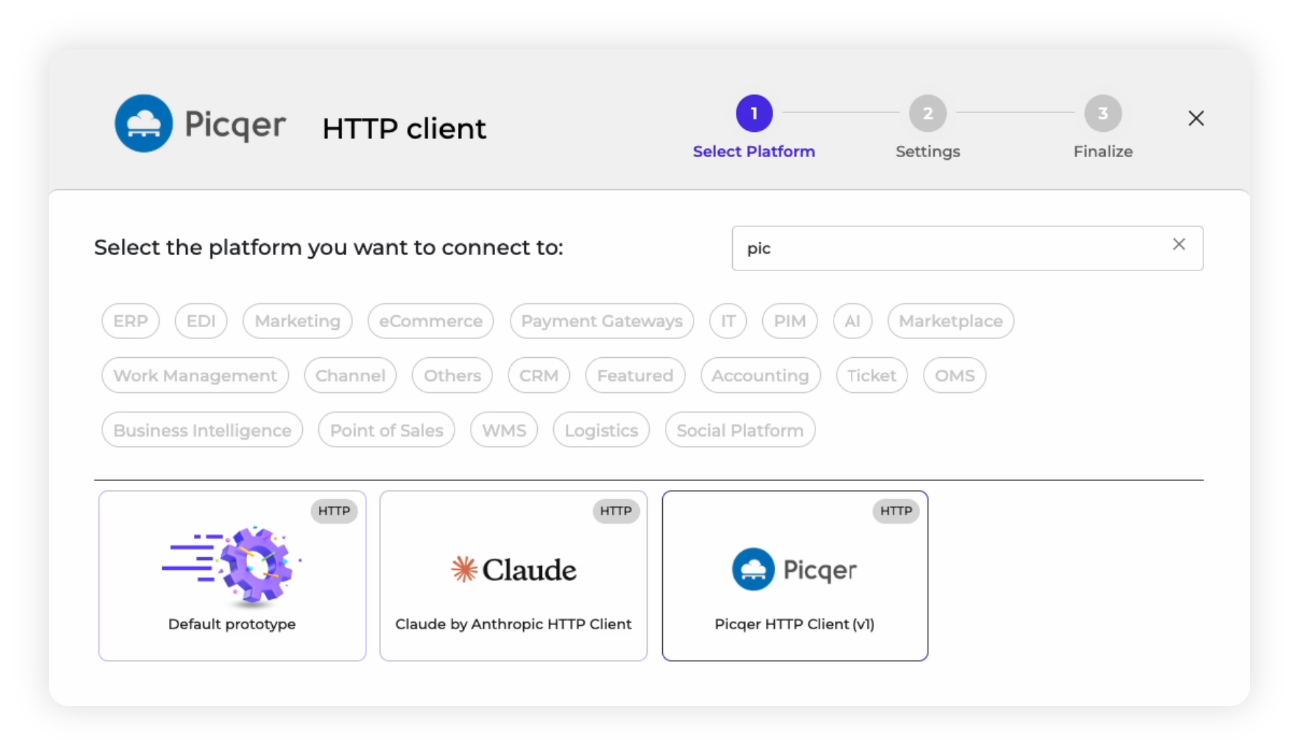
3. Choose Connector: Search for the first application you wish to integrate with the wizard. As per our example, we need to search for Picqer and select it to start configuring our HTTP client.
Please note: if the application you wish to integrate is not in our list of Connectors, you can choose the “Default prototype” option that you see in the wizard to build a custom integration. You can use this option to configure all the details and authentications from scratch to connect your desired endpoint from scratch.
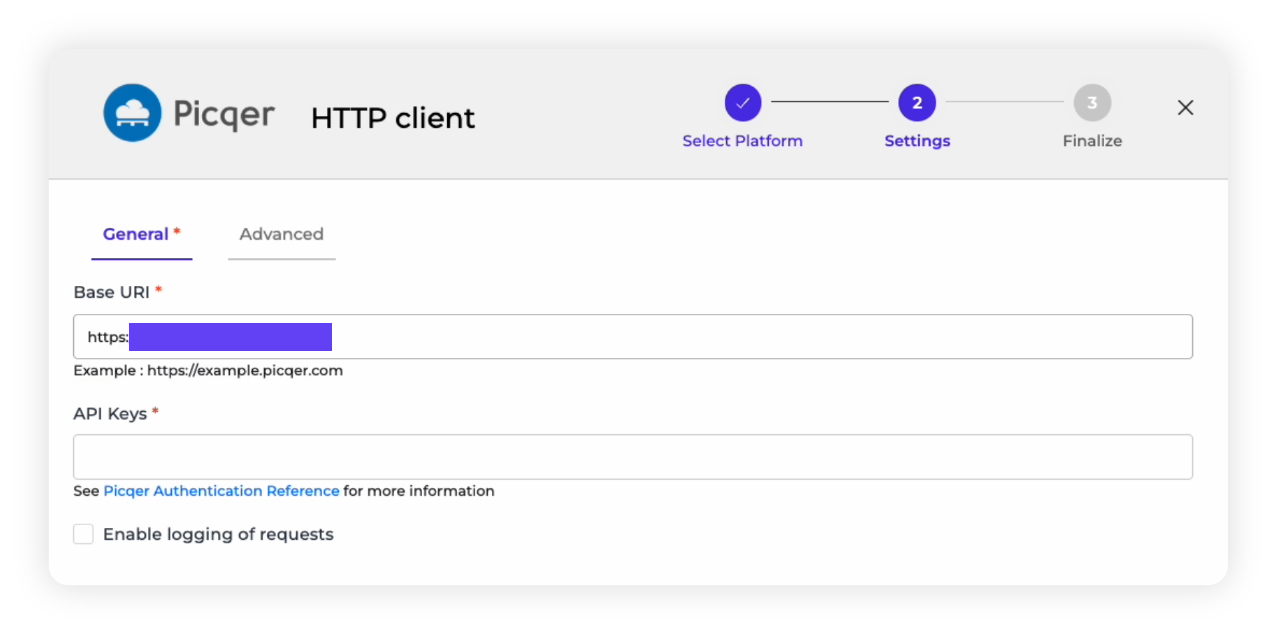
4. Enter credentials: Next, you must enter the URL of your application (Picqer) to establish a link with your specific environment within the app. You have to also enter your API key to authorize interactions with your application through its API. As you can see below the API keys field, Alumio may also provide help text and a link to find the authentication details for your application.
Note: Alumio also provides the option to save and encrypt these credentials to reuse in subsequent integrations under the “Environment Variables” option.
5. Enable logging: You can also choose to enable the “logging of requests” and then select a logging format, based on how detailed you want it to be. In this case, as you can see, we recommend the “Headers only” logging option.
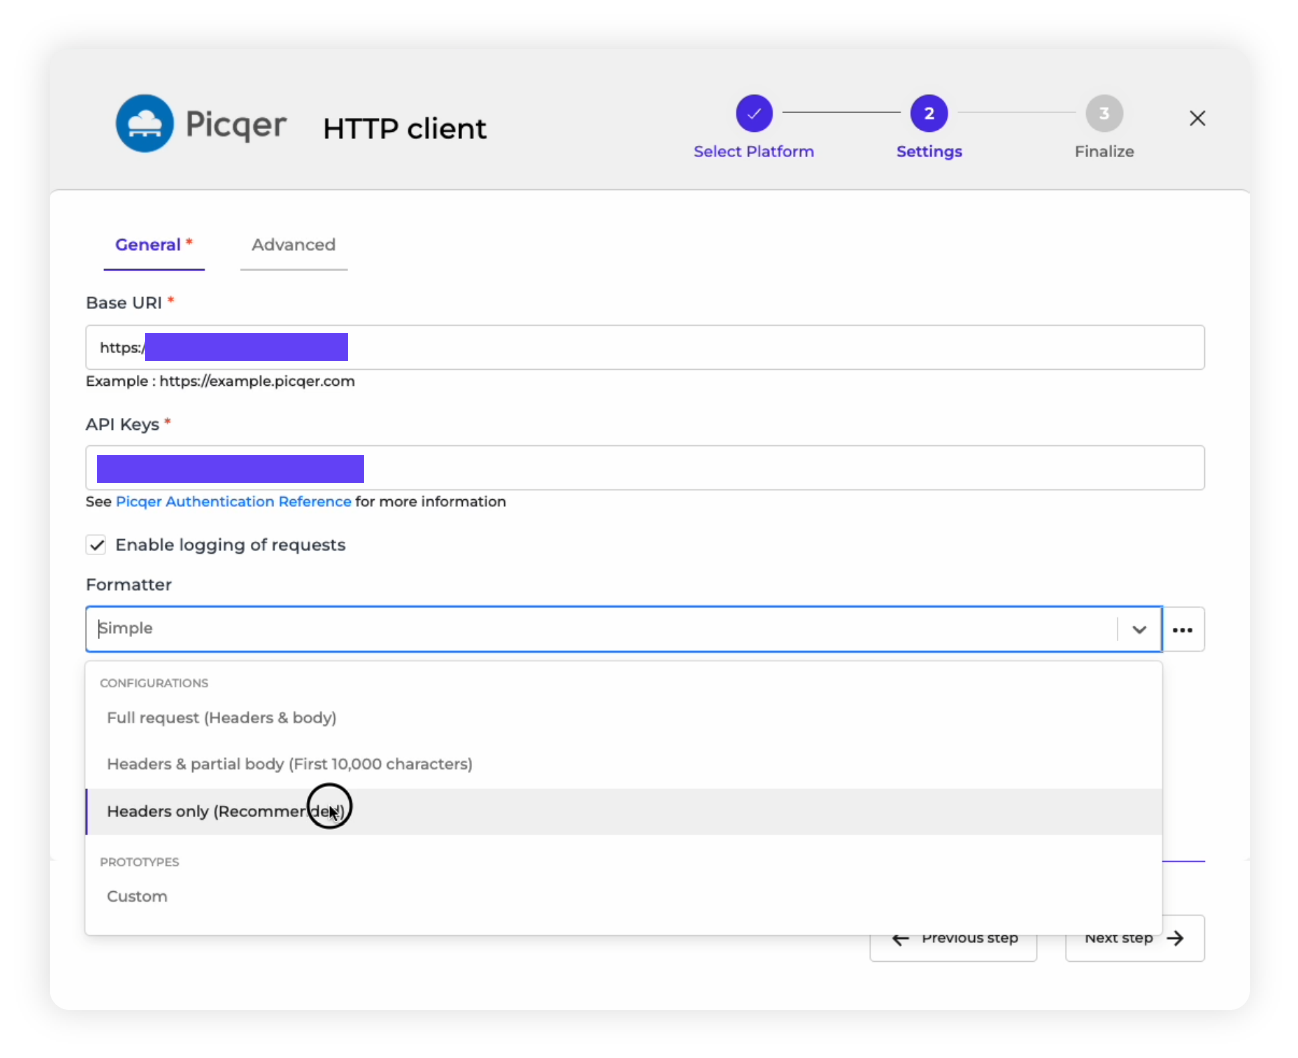
6. Finalize HTTP client: You can now finalize your HTTP client by checking all details and giving it a name. In this case, we will call it the “Picqer HTTP client” and click on the “Save” button.
Step 1(b): Setting up a connection method for application B
Now that we’ve established a connection method for our first application, Picqer, we need to replicate the process to do the same for the application we want to send the data to (Shopify, as per our example).
1. Connections: Move to the navbar at the top and select the connection method you wish to use. In this case, we will also choose the HTTP (API) method by clicking the “+” icon next to it.
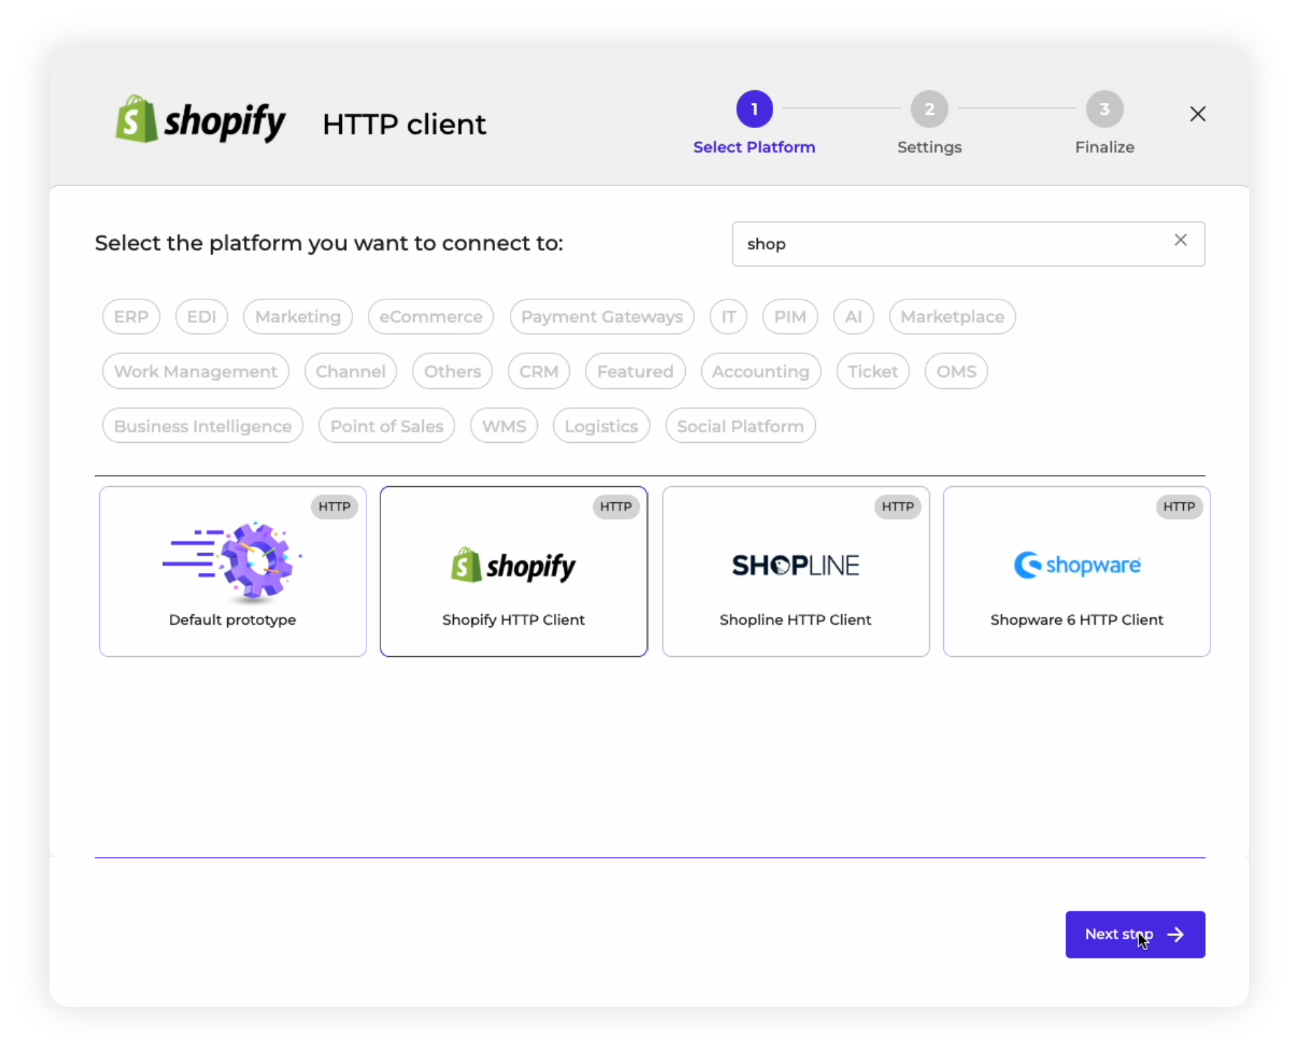
2. Connectors: This will open our HTTP client connection wizard, which we can use to search for the Connector of the second application you wish to integrate via Alumio.
3. Choose Connector: Search for the application you wish to integrate with the HTTP wizard. As per our example, we simply search for Shopify and select it to start configuring our HTTP client.
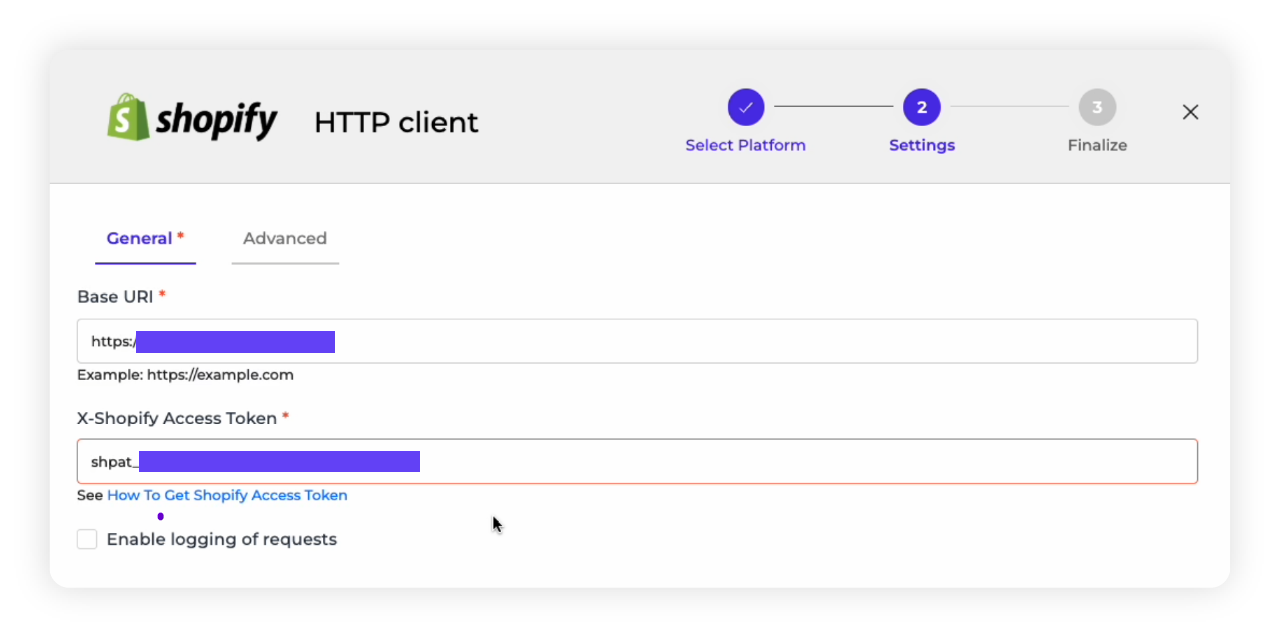
4. Enter credentials: Next, we must enter the URL for the application, in this case the link to our Shopify web store. This will establish a link with our specific Shopify web store. In the case of Shopify, we have to enter your Access Token to authorize interactions with the application through its API. As you can see below the “X-Shopify Access Token” field, Alumio provides help text and a link to find the authentication details for your application.
Note: As mentioned earlier, you can save and secure these credentials for reuse under the Environment Variables section.
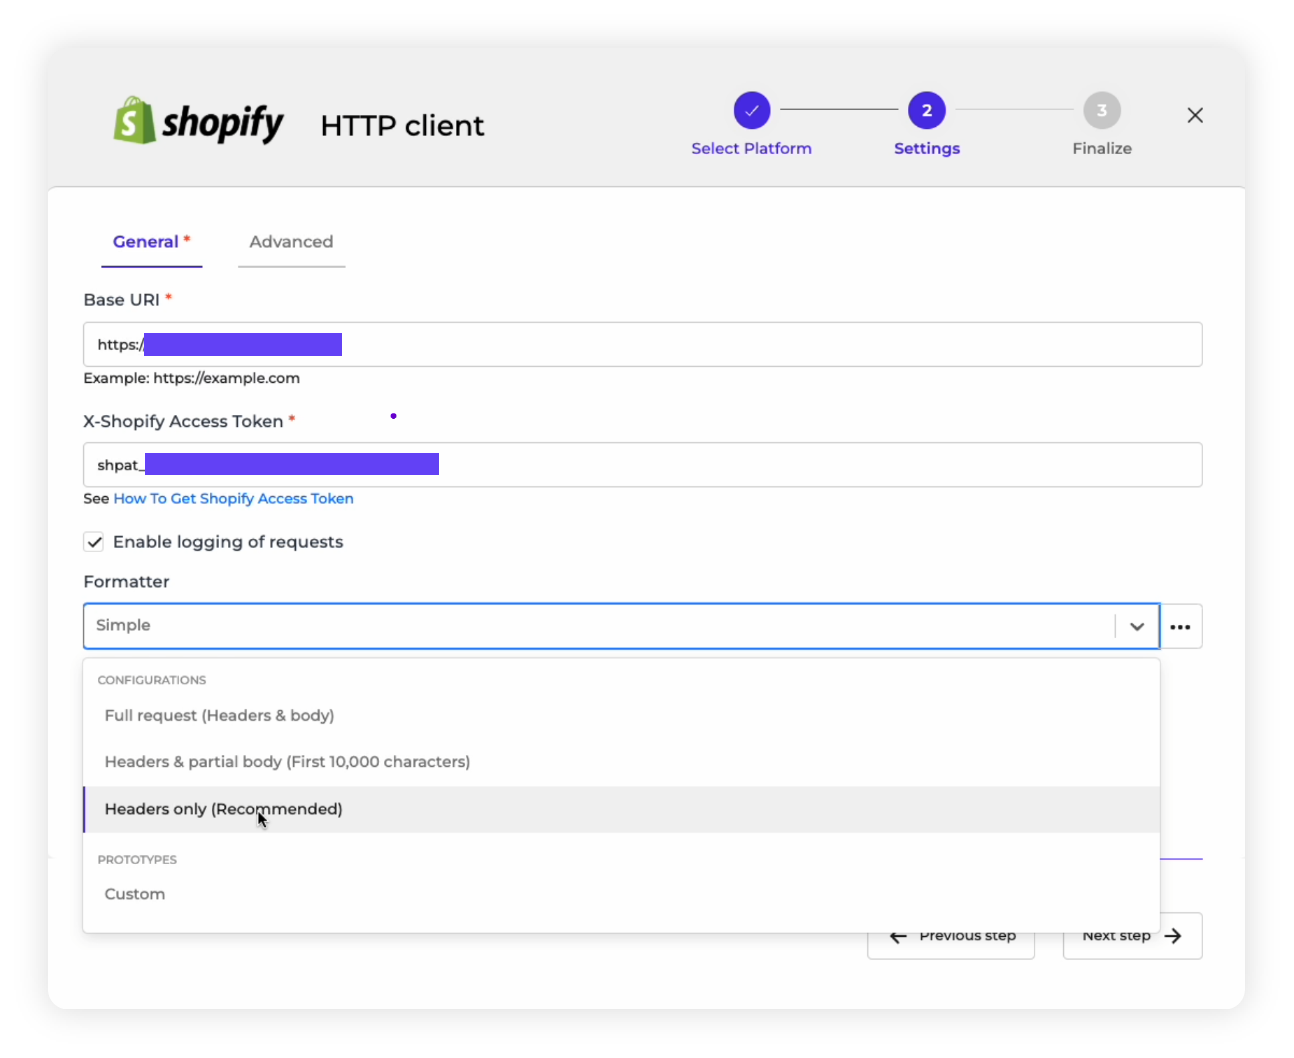
5. Enable logging: You can choose to enable the “logging of requests” and then select a logging format, based on how detailed you want it to be. As recommended before, we choose the “Headers only” logging option.
6. Finalize HTTP client: You can now finalize your HTTP client by checking its details and giving it a name. In this case, we will call it “Shopify HTTP client” and click on the “Save” button.

Step 1(c): Testing your connection method
After creating and saving our Picqer and Shopify HTTP clients, Alumio also provides a “Configuration Tester” to check if we’ve managed to establish our connection method successfully.
1. We can find our newly created HTTP clients for Picqer and Shopify within Alumio, where you can check the details of each client. As per our example, we can select the Picqer client we built to view its details. The interface that it leads to will display our “Configuration Tester” on the right side.
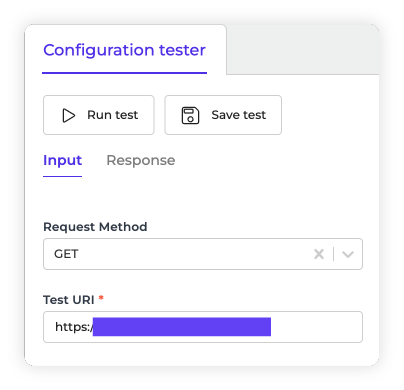
2. Within the “Configuration Tester,” we can run a test to see if Alumio can successfully pull data from Picqer by adding our URI and choosing a “Request Method.”

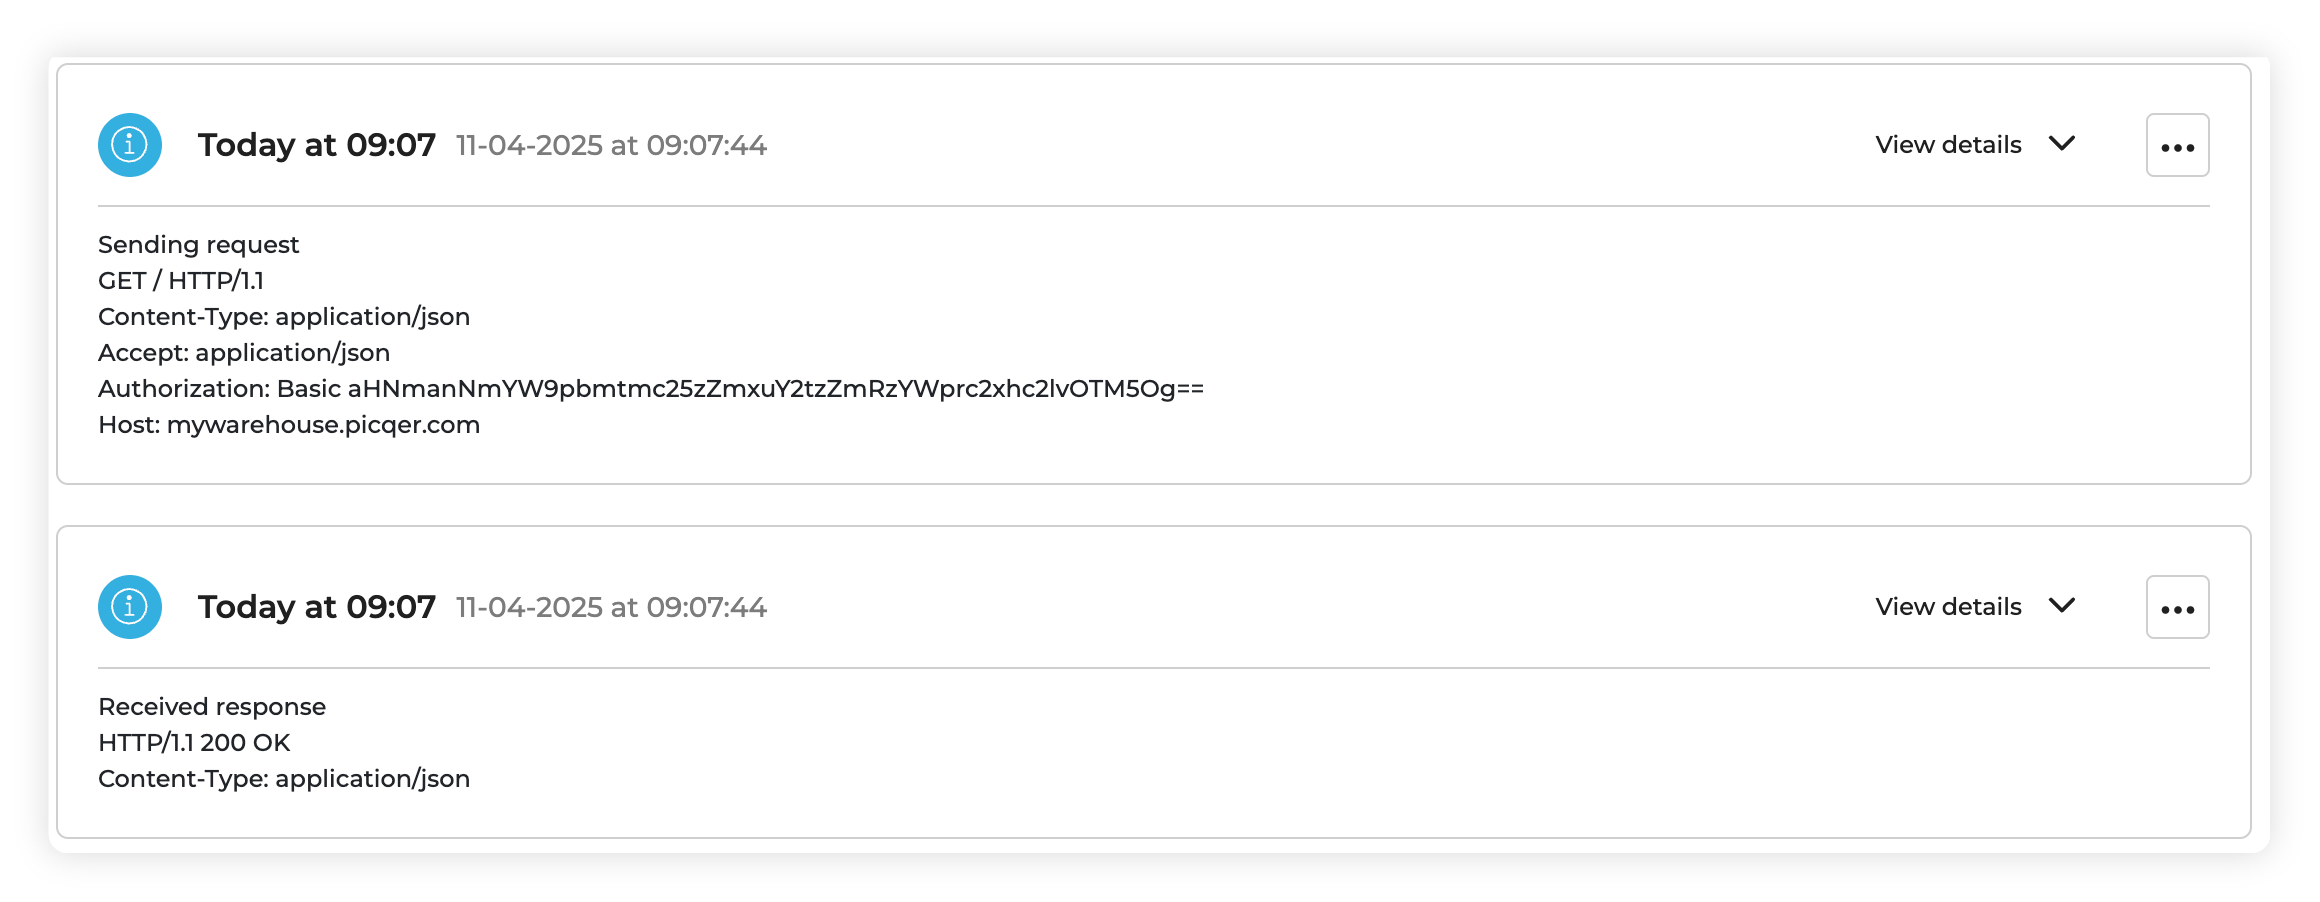
3. If the connection works, we will receive a success indicator or 200 OK responses when clicking on the “view logs.” This means that our connection is set, and now Alumio can talk directly with our Picqer application and account. If you received a failed response, you need to check your API key and your URI.
4. We can also run a similar test to validate the HTTP client we’ve created for Shopify.
These initial steps of setting up the proper connection method for applications you wish to integrate are critical. It establishes the necessary communication link between your application and external services, enabling secure and seamless data exchange and interaction with APIs. After creating and saving your connection method with an application for the first time, you can simply reuse this connection method when creating more integrations with the particular application.
Now that we’ve established a connection and method of communication with the APIs of both applications we wish to integrate via Alumio, we can now start configuring the integration itself. Let’s now dive into building the Route to define and deploy our integration.


